AccessEngineering is an interactive online reference and learning tool that helps engineering students access knowledge. It draws upon a repository of the world's most important engineering information, to help find solutions to real world problems, answer important questions, and get the right results fast.
It comprises dynamic online features, such as instructional, faculty made videos, calculators, interactive tables and charts, as well as personalization tools allowing users to organize crucial project information as they work.
The right answer is a few clicks away
No matter what the engineering course, every student has searchable access to a single up-to-date content solution for assignments and revision.
Including luminary texts like Perry's Handbook for Chemical Engineers and Marks' Standard Handbook for Mechanical Engineers, this authoritative reference and multimedia material is constantly vetted and updated.
The interactive and personalised interface allows students to easily organise resources, annotate critical information, revise, and solve analytical problems.
See how quickly and easily this multidisciplinary engineering content can be accessed, making answers to problems a few clicks away.
Comprehensive & trusted range of resources

Progress quicker, save time
Boost productivity whilst saving time

AccessEngineering makes course preparation easier and more efficient enabling educators to achieve more. Ready-to-use curriculum maps tie relevant content from classic references and up to date material, to relevant videos on core engineering subjects.
For students, discovering the right information and curating content quickly and easily, makes learning time more productive.
DataVis, a visualisation tool that helps students complete active learning projects, instantly displays data in dynamic visualisations such as interactive dot-plots and scatterplots, enabling them to tell stories with that data. This database of 200 materials and 65 properties provides students with enough data to learn about material properties without overwhelming them.
Click here to watch how DataVis allows students to easily explore relationships between different material properties.
Quick solutions to real life problems
AccessEngineering isn't about knowledge for knowledge sake, it's about applying that knowledge to prepare for professional life.
Over 690 faculty-created instructional videos, with more added every month, demonstrate step-by-step solutions to real-world engineering problems.
For life outside the classroom, a suite of business content, including videos, help build management, presentation and process skills.
So, does your educational institution have a diverse learning environment, that allows students to use knowledge more effectively in the real world?
Preparing for students life

Spreadsheet Calculators
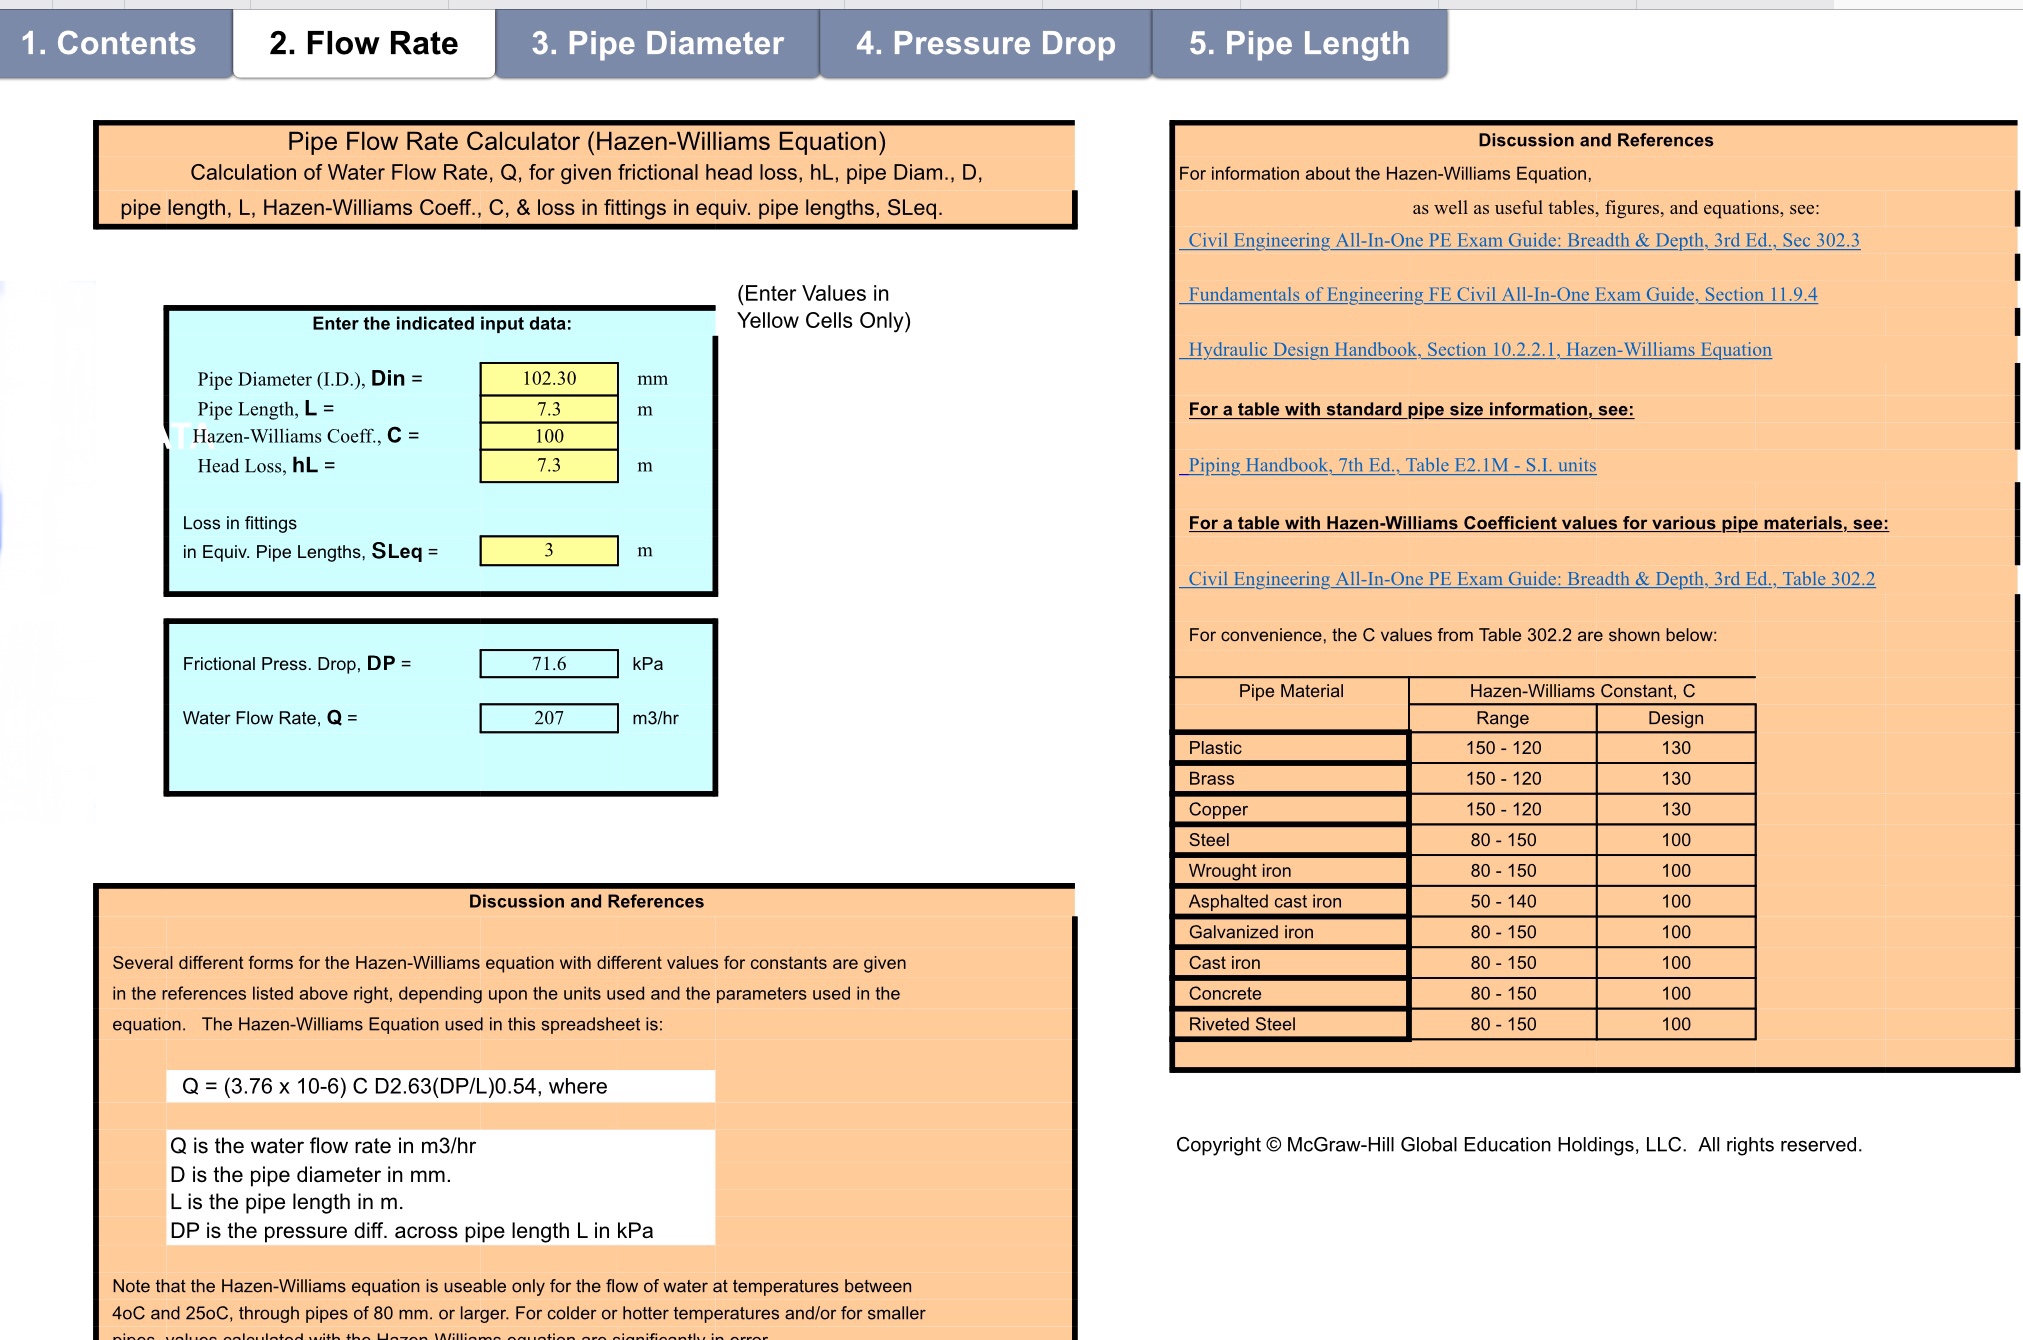
Our calculator tools streamline calculations that are time-consuming to perform by hand. By embedding the relevant formulas directly into Excel workbooks, they enable you to enter input data and quickly get the answer you seek within a software program that you already use daily.
- Some of the new calculators include:
- Hazen-Williams Pipe Flow Calculations
- MBR Process Design Calculations
- Thermodynamic P-V-T Calculations for Gases
Direct links to the source content and additional related material are provided for all calculations.
Videos, Graphs & Tables
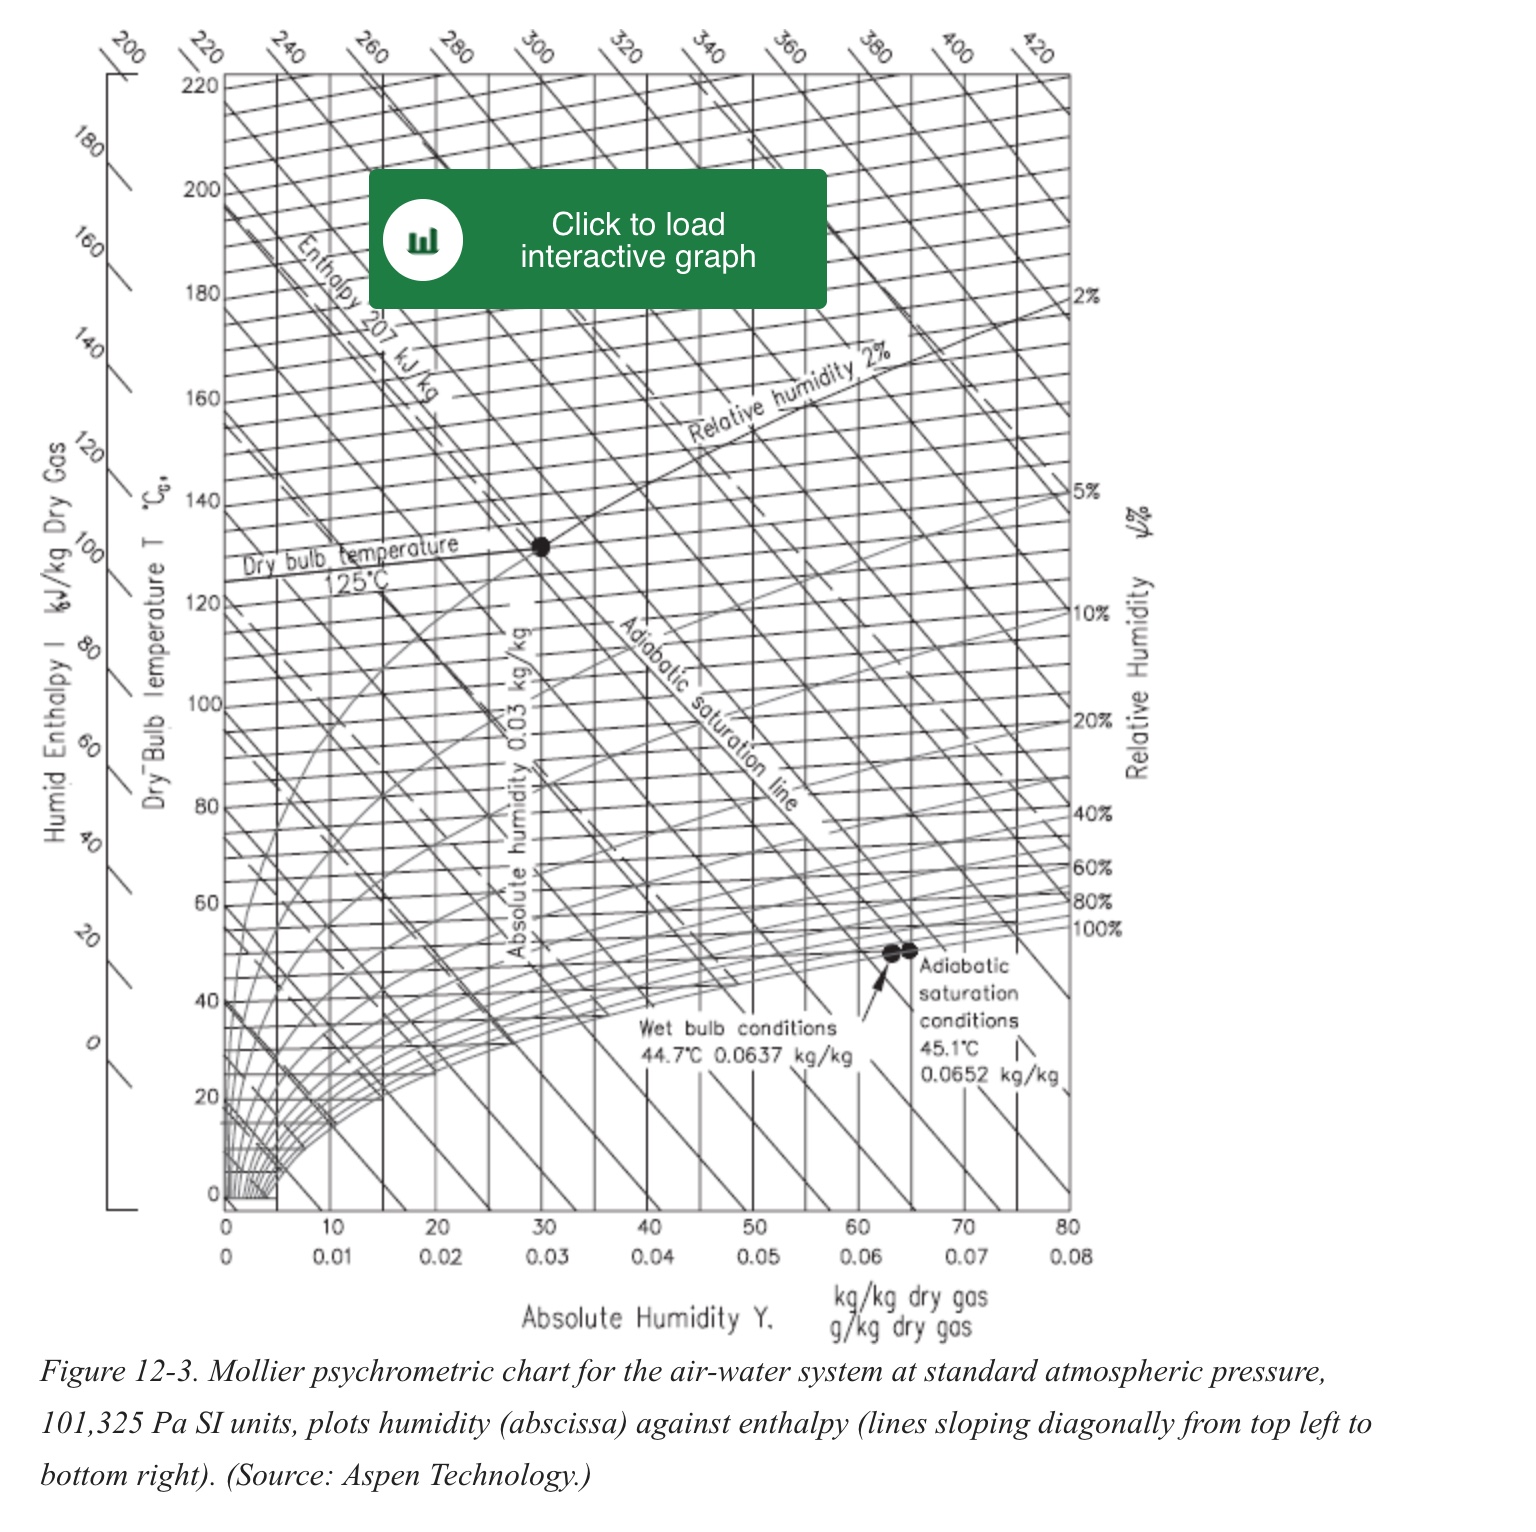
AccessEngineering also comprises dynamic online features, such as instructional, faculty made videos and interactive tables and charts.
- More than 900 easy-to-understand instructional videos, exclusively created for AccessEngineering. Covering every major discipline, you’ll learn step-by-step solutions to real-world engineering problems.
- Use the graphs and tables to analyse key data quickly and accurately.
- Thousands of interactive graphs and downloadable tables make it easy to analyse essential engineering data and confidently use it in real-world projects.
DataVis
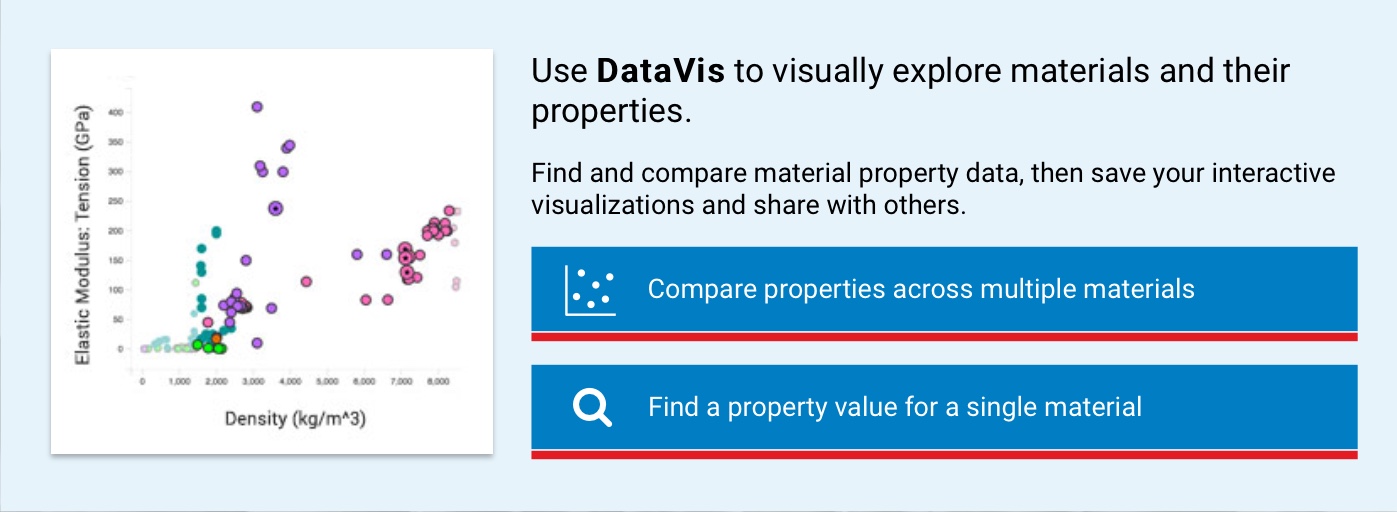
Use DataVis to visually explore materials and their properties. Find a property value for a single material or compare properties across multiple materials. Save your interactive visualizations and share with others.
- Dot plot or scatter plot visualisation
- Tabular data
- Project library
These faculty-created, active learning projects can be used as-is, or copied and customized for your own course.
If you would like to try the platform for yourself, please complete the form below.